Colour · 04.4
Test charts
A known reference in the frame is the only way to find out what a device is actually doing to colour.
In this entry
- A colour you already know is the only ruler that fits
1 parts · Colour 04.4
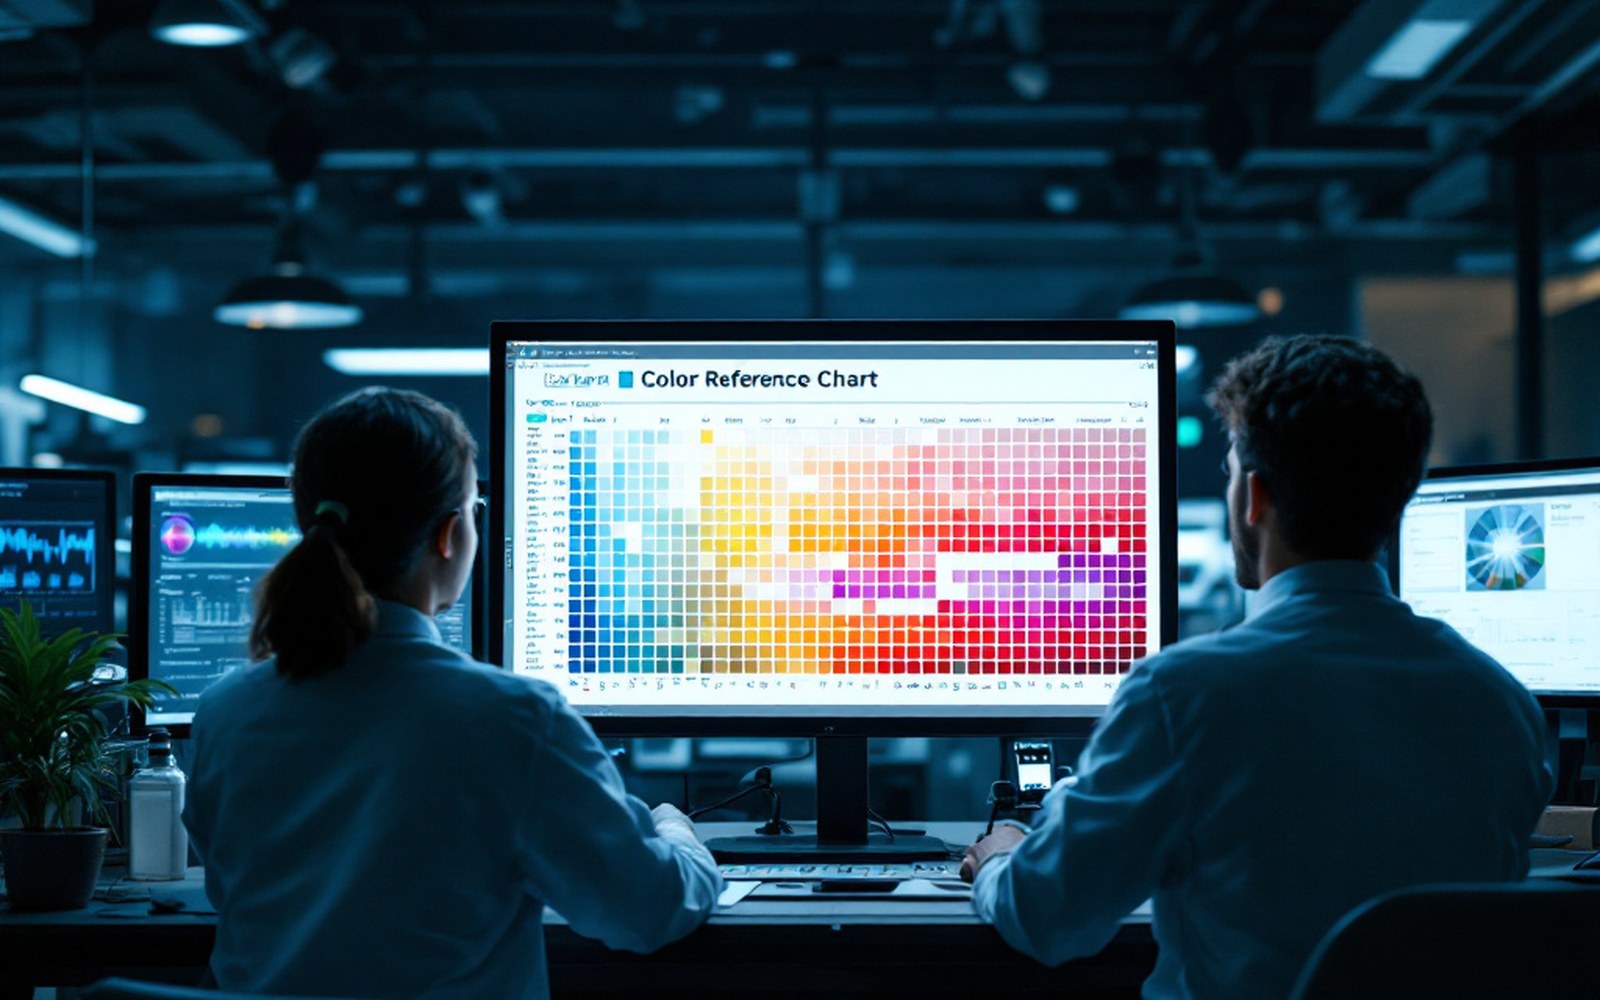
Photo: RazorArt asset kit
A colour you already know is the only ruler that fits
A camera, a scanner, a monitor, a printer: every device in an imaging chain interprets colour according to its own physics, and none of them agree by default. The test chart exists to surface that disagreement. It is a physical or synthetic target carrying patches of known colorimetric value — values measured against an absolute reference, usually traceable to standards held by a national metrology institute. You photograph or scan the chart, compare what the device returns with what the chart is known to contain, and the difference maps the device's behaviour exactly.
The most widely used physical target is the Macbeth ColorChecker, introduced in 1976 by McCamy, Marcus and Davidson. Its twenty-four patches span neutral greys, memory colours — sky, foliage, skin — and a set of spectrally varied primaries, all specified in CIE coordinates so they can be re-measured on any calibrated spectrophotometer. The chart's power comes not from the number of patches but from their spectral diversity: they respond differently under different illuminants, which means a single capture exposes both a sensor's spectral sensitivity and whatever the lighting is doing.
IT8 targets, standardised for film and flatbed scanner characterisation, extend the patch count into the hundreds and are the basis of the ICC profiling workflow governed by the International Color Consortium. When a scanner reads an IT8 chart of known values, the profile-building software constructs a mapping — a colour profile — that translates the scanner's raw output into a device-independent colour space. Without the reference chart, that mapping cannot be anchored to anything real.
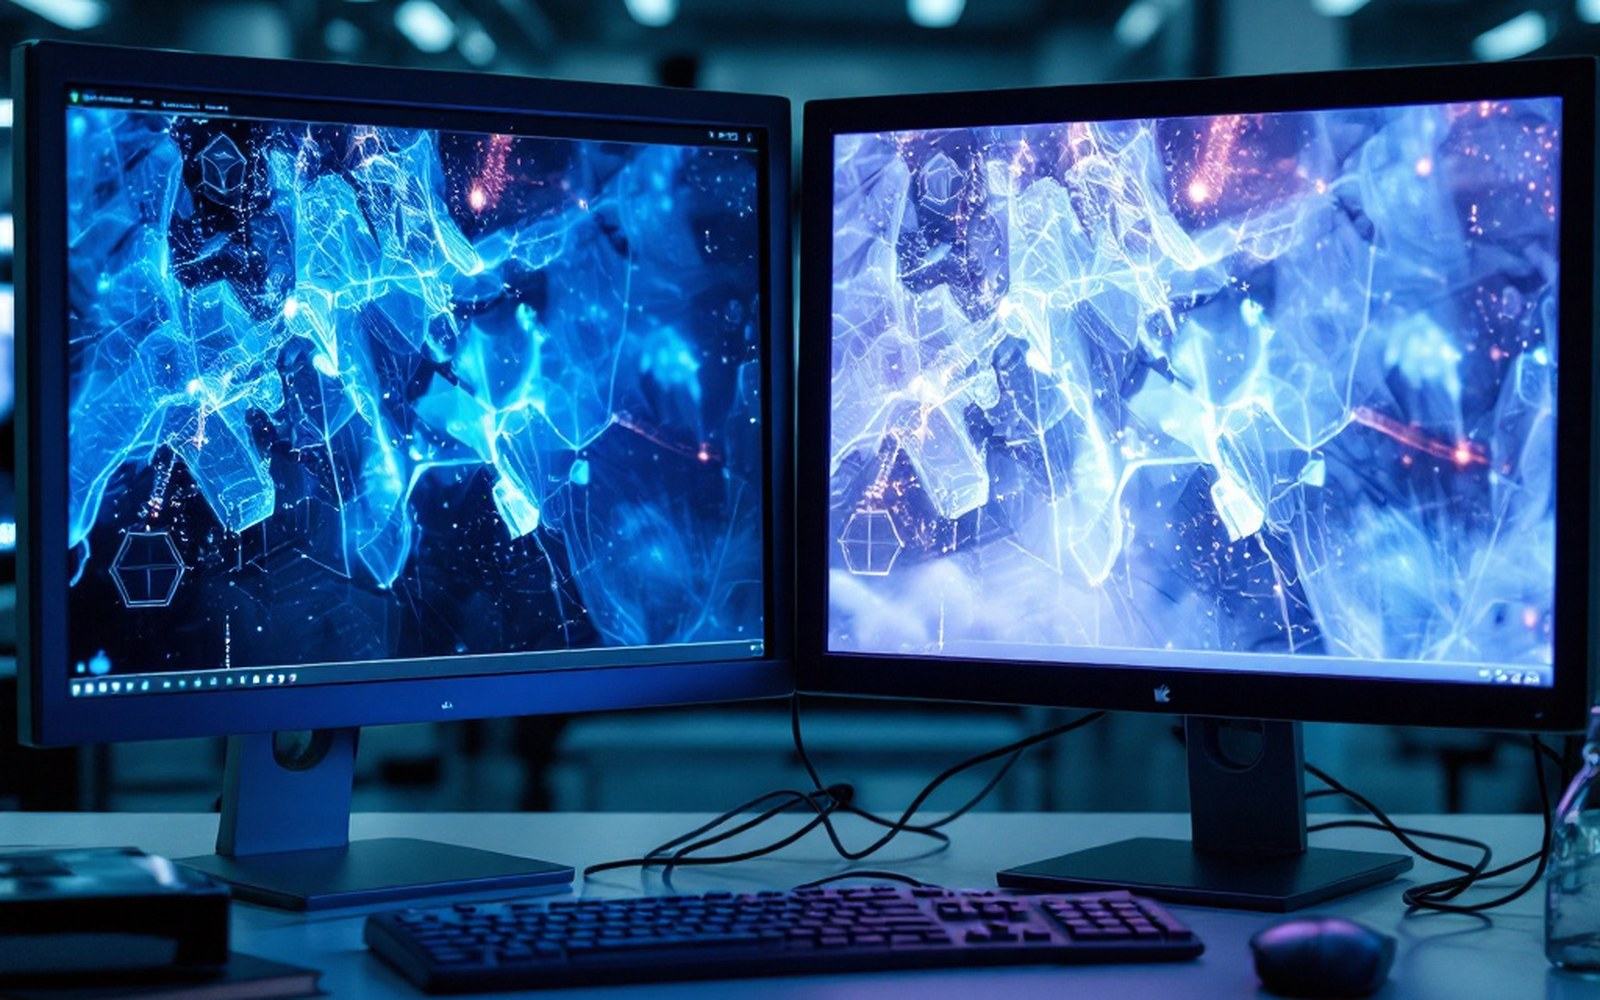
A synthetic chart, rendered in software with mathematically exact values, serves the same role in a display or render pipeline: inject known tristimulus values, measure what the screen emits with a colorimeter, close the loop. The chart does not change what the device does; it reveals it, precisely enough that the difference can be corrected.
A camera, a scanner, a monitor, a printer: every device in an imaging chain interprets colour according to its own physics, and none of them agree by default.


Related in Colour