Colour · 04.3
CIE 1931: The Seventeen Observers Who Set the Baseline for Every Colour System
A model of what the eye responds to, built from experiments on a small number of observers, that still underpins every colour system in use.
In this entry
- The Problem That Required a Standard
- Colour-Matching at the Threshold of Vision
- A Map of Colour: The Chromaticity Diagram
- Limitations Held in Place by Inertia
5 parts · Colour 04.3
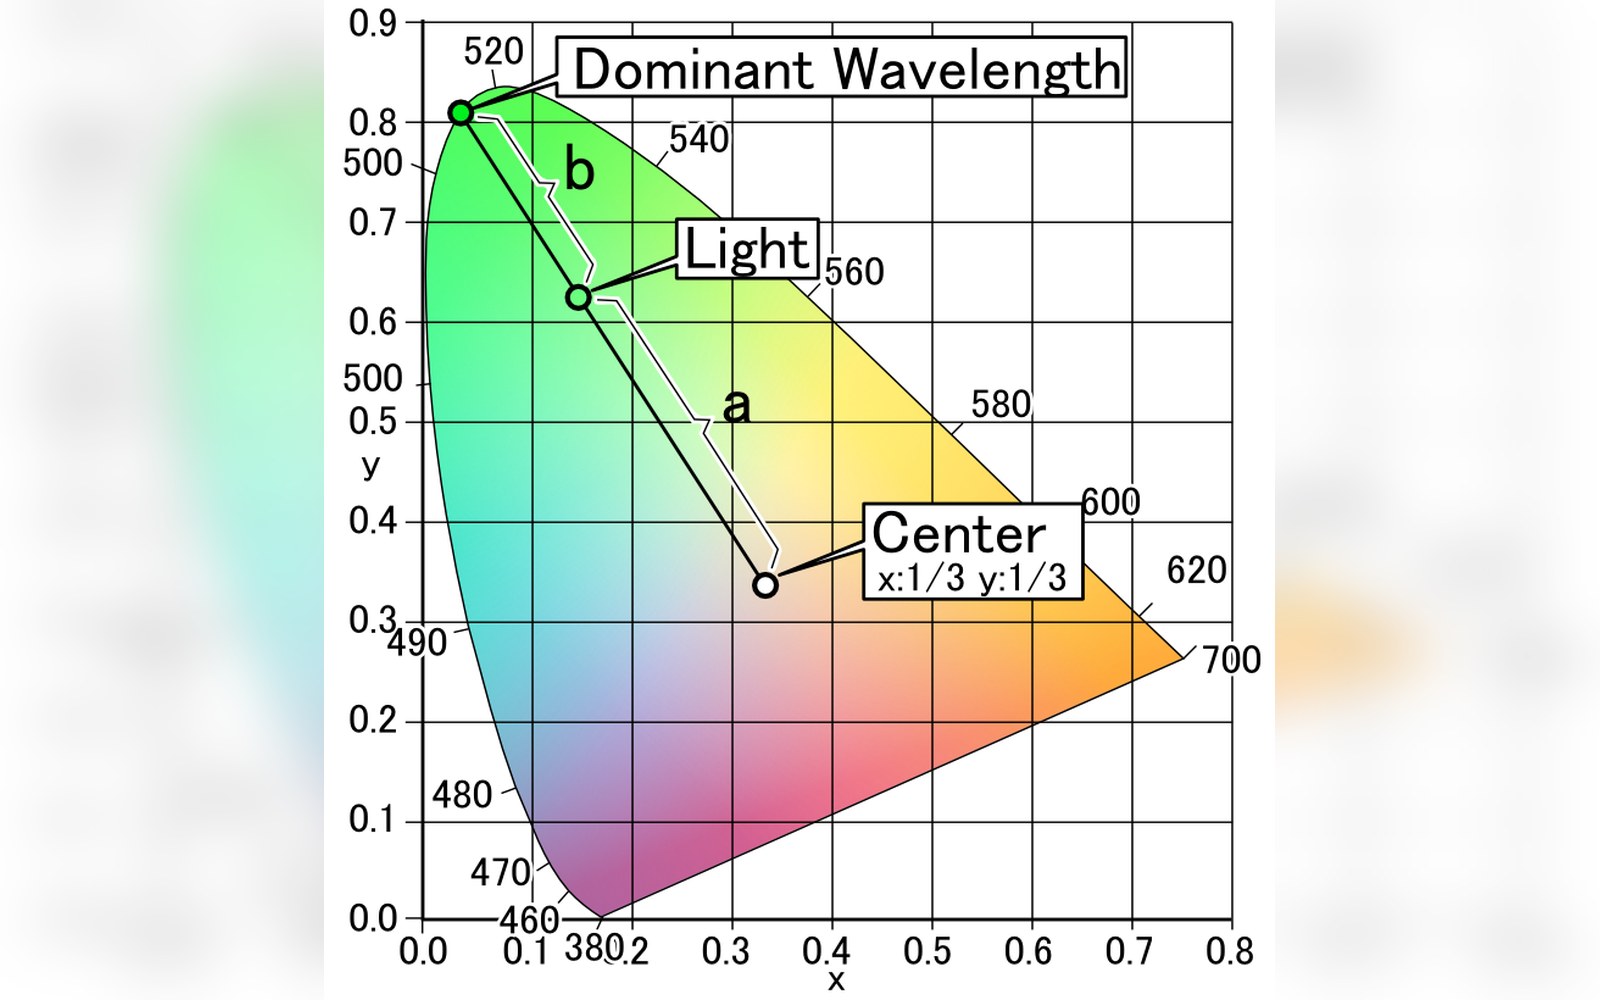
Photo: CIE Lighting (dominant wavelength, color purity) · Wikimedia Commons
The Problem That Required a Standard
Colour had been measured in fragments for decades before anyone found a way to measure it consistently. Albert Munsell had built his notation system around perceptual spacing — equal steps that looked equal — and Frederic Ives had done careful spectrophotometric work, but neither produced numbers a manufacturer in one country could hand to a printer in another and expect the same result. The trouble was fundamental: colour is not a property of light alone. It is what happens when a particular distribution of wavelengths meets the particular biology of a human eye, and eyes vary.
The Commission internationale de l'éclairage — the CIE, founded in 1913 — existed precisely to standardise photometric and colorimetric measurement, and by the late 1920s it had identified the missing piece. Before you could build any transferable colour system, you needed a mathematical description of what an average human eye actually does with light. That meant experiments.

Colour-Matching at the Threshold of Vision
Between 1928 and 1931, two independent research groups conducted the colour-matching experiments the CIE would ratify. William David Wright, working in London, ran his experiments from 1928. John Guild followed shortly after at the National Physical Laboratory in Teddington. The method was conceptually simple: a human observer sat at a viewing aperture divided into two halves. One half showed a monochromatic test light of known wavelength; the other showed a mixture of three primary lights — red, green, and blue — whose intensities the observer adjusted until both halves looked identical. At the point of a match, the three primary intensities were recorded.
The experiments were slow and exacting, and the total number of observers was small — Wright used ten, Guild used seven, and their populations overlapped only a little. Together the results covered the visible spectrum step by step. The curves produced — the amount of each primary needed to match each test wavelength — are called colour-matching functions. Where a value went negative, the observer had to add that primary to the test side to achieve a match, because no mixture of the three primaries on the other side could otherwise reach that colour. Those negative values were mathematically correct but experimentally awkward.
The CIE solved that in 1931 by applying a linear transformation. By choosing three hypothetical primaries — imaginary lights that do not exist in nature but span all real colours — the CIE rewrote the colour-matching functions as three smooth, entirely positive curves. These became the x̄, ȳ, and z̄ standard observer colour-matching functions. The tristimulus values X, Y, Z that follow from integrating those functions against any spectral power distribution give every real colour a unique address in a three-dimensional space.
A Map of Colour: The Chromaticity Diagram
The 1931 system immediately produced one of the most reproduced diagrams in the history of measurement. If you discard the brightness dimension by normalising — dividing each tristimulus value by the sum of all three — you get chromaticity coordinates x and y that sit in a two-dimensional plane. Plot every colour the eye can distinguish, and the boundary of that region is a horseshoe-shaped curve called the spectral locus, tracing pure monochromatic colours around its curved edge and closing at the bottom with the line of purples, which have no single-wavelength equivalent.
Inside that horseshoe lives everything. The gamut of a monitor, a film stock or a paint pigment appears as a polygon whose corners are the device's primaries. Colour temperatures of illuminants — the bluish white of an overcast sky, the orange of tungsten — run along a curve through the interior called the Planckian locus. The CIE chromaticity diagram is not perceptually uniform: an equal step in the green region covers fewer distinguishable colour differences than a step in blue-green, a deficiency later addressed by the CIE 1976 UCS (uniform chromaticity scale) and the CIELAB colour space. But the underlying 1931 tristimulus values remain the root; every subsequent transformation is built on top of them.
Colour had been measured in fragments for decades before anyone found a way to measure it consistently.
Limitations Held in Place by Inertia
The 1931 standard observer has known problems, and the CIE has never pretended otherwise. The population of seventeen observers was almost entirely European, young, and male; the viewing field was a two-degree circle, which means only the fovea was stimulated, leaving out the rods and the rod-dominated periphery. In 1964 the CIE issued a supplemental ten-degree observer built from later experiments with a wider field and more observers, and that version is preferred for larger objects. Neither population would today be considered adequate for establishing a biological standard — the sample sizes are far too small by modern statistical norms.
Yet the 1931 standard observer has not been replaced. Every ICC profile, every display calibration target, every colour space conversion routine in use today still traces its chain of custody back to those curves. The reason is practical: the entire infrastructure of colour management — in printing, broadcast, cinema, and screen manufacturing — is built on top of it, and migrating even one layer of that stack requires mapping it back to a common anchor. The 1931 data is that anchor, frozen in place less by its perfection than by the cost of changing it.
Key numbers
Still the Foundation
The International Color Consortium, whose ICC profile format underlies colour management on virtually every operating system, encodes connection spaces in XYZ and CIELAB — both derived directly from the 1931 functions. When a display manufacturer characterises a panel, when a scanner is profiled, when a film conversion is done, the numbers pass through the 1931 observer on the way. Alvy Ray Smith's work on digital colour in the early years of computer graphics assumed a colorimetrically defined working space; so did the framebuffer research at Xerox PARC. The CIE 1931 standard is not a historical curiosity — it is the substrate, still running under everything.


Related in Colour